Home
Population Standard Deviation in R - Sum of Squares, Variance, SD in RStudio
2 สัปดาห์ที่ผ่านมา
1:50
Draw Normal Curves in RStudio with shading -Calculate Probabilities & Critical Z Values
3 สัปดาห์ที่ผ่านมา
4:16
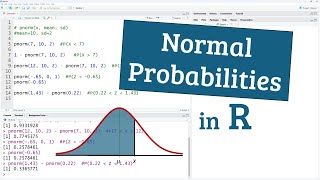
Areas under Normal Curve in R | Calculating probabilities in R Studio
1 เดือนที่ผ่านมา
1:38
Mean, Standard Deviation, Variance on BA II Plus Calculator | Probability Distribution x̄, SD, σ²
2 เดือนที่ผ่านมา
2:22
Discounted Cash Flows on BAII Plus – NPV, IRR, PB, DPB, PI - DCF - Capital Budgeting
2 เดือนที่ผ่านมา
3:10
General Annuity Problems Solved in Excel or Google Sheets – FV & PV: Ordinary (END) & Due (BGN)
2 เดือนที่ผ่านมา
5:18
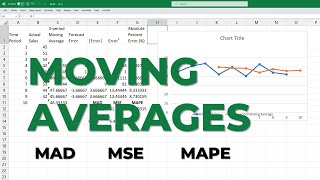
Moving Averages in Excel -MAD (MAE), MSE, MAPE | Forecast + Graph
2 เดือนที่ผ่านมา
5:58
Draw Bell-Shaped Curves in Microsoft Excel and PowerPoint | Normal Distribution | Shade area
3 เดือนที่ผ่านมา
3:32
Annuity Calculations in Excel – FV, PV, PMT, N | Simple - Ordinary (END) & Due (BGN)
3 เดือนที่ผ่านมา
10:00
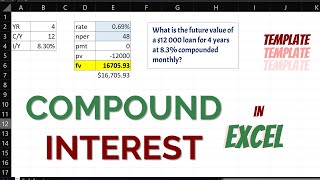
Solved: Compound Interest Problems in Excel–Future, Present Values, Rate, Periods Examples +Template
3 เดือนที่ผ่านมา
6:13
Solved Examples: Normal Approximation to Binomial Distribution -Probability | Continuity Correction
3 เดือนที่ผ่านมา
6:40
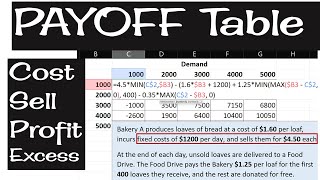
Create Payoff Table | Excel | Cost, Selling Price, Profit, Shortage, Excess, Demand/Supply
4 เดือนที่ผ่านมา
3:27
Solved -Probabilities: AND, OR, GIVEN | Joint, Conditional, Union + Complements
4 เดือนที่ผ่านมา
2:39
Hypothesis Test for Proportion Template in Excel/Google Sheets | Critical & P-values
4 เดือนที่ผ่านมา
2:42
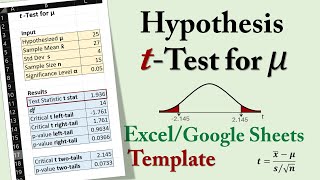
Hypothesis t-test Template for mean in Excel/Google Sheets | Critical & P-values
5 เดือนที่ผ่านมา
2:49
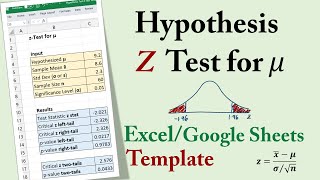
Hypothesis Z-test for mean – Excel Template | Hypothesis Testing | critical & p-values
5 เดือนที่ผ่านมา
5:59
Binary Integer LP – Capital Budgeting – Formulation + Solution
5 เดือนที่ผ่านมา
9:07
Solving Math/Stats Problems in Copilot - Bing Chat - Prompt Engineering basics
6 เดือนที่ผ่านมา
6:28
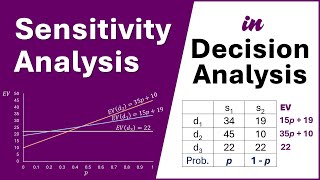
Decision Analysis - Sensitivity Analysis | Find p | Draw Graph | Data Table in Excel
7 เดือนที่ผ่านมา
5:09
Solved - Hypothesis - Proportion Test | Z test, P-value | First-time home buyers
7 เดือนที่ผ่านมา
3:01
Construct Horizontal Boxplot | Excel + PowerPoint to Word
7 เดือนที่ผ่านมา
3:55
Hypothesis Testing 2-tailed: Solved Problem: Quiz 10#5
8 เดือนที่ผ่านมา
6:41
Calculating Bond Value (Price) | Formula | Excel | BA II Plus calculator
8 เดือนที่ผ่านมา
6:16
Special LP Cases in Simplex Method | Infeasibility, Alternative Solutions, Unboundedness, Degeneracy
8 เดือนที่ผ่านมา
9:20
Initial Simplex Tableau setup | Artificial Variables, Slack, Surplus | Iteration 0
9 เดือนที่ผ่านมา
8:27
Paired t-test | Dependent Samples | Hypothesis test| Confidence Interval
9 เดือนที่ผ่านมา
6:28
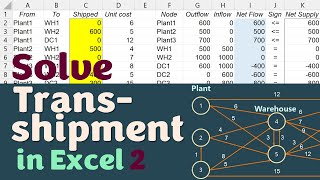
Solve Transshipment in Excel 2 - Network Flow - Shipment between any 2 nodes
10 เดือนที่ผ่านมา
7:24
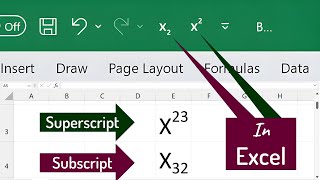
How to type Subscript & Superscript in Excel
10 เดือนที่ผ่านมา
1:15
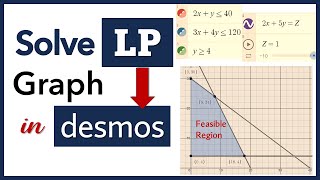
Solve Linear Programming Graph in Desmos (FREE) | LP Optimal solution | Maximize | Minimize
10 เดือนที่ผ่านมา
4:49
Scatterplot in Excel | Scatter Diagram | Residuals from Graph | Slope | Intercept | R-Square
10 เดือนที่ผ่านมา
3:14